How to pick Growth Stocks
Disclaimer: Stocks mentioned in this article are not a recommendation or advice to buy/sell.
In this article, I outline the complete framework I use to identify Growth Stocks for my watchlist (🔒Unlock with premium tier), with the objective of outperforming the S&P500 over the long term.
The framework consists of the following components:
- Core Selection Principle
- Criteria 1: Circle of Competence
- Criteria 2: Moat/ Product USP
- Criteria 3: Secular Trend and Total Addressable Market
- Criteria 4: Consistently Growing Financials with Stable Base
- Criteria 5: Optionality & Catalysts
- Criteria 6: Management
- Criteria 7: Culture
- Criteria 8: Stock Price Trend
- Criteria 9: Valuation
Caveat: This framework is designed for long-term investing, with a minimum horizon of five years. It is not intended for short-term trading or for identifying stocks to generate quick gains over a few months or one to two years.
Core Selection Principle
The core principle underlying this framework is Charlie Munger’s Principle of Inversion. Rather than asking, “Why should I invest in this company?”, I systematically look for reasons not to invest. This is intentional.
As I work through each of the 9 criteria, any company that meaningfully fails even one of them is placed into a “not-for-me” pile, and I move on.
This inverted approach serves two purposes.
First, it reduces risk incrementally. By eliminating companies with clear weaknesses, I avoid the trap of confirmation bias, where investors focus on justifying an investment rather than objectively assessing its flaws. Only when I cannot find a compelling reason not to invest do I proceed further.
Second, it saves time. Time is a finite resource with real opportunity cost. Instead of over-analyzing or forcing a thesis on a company that clearly violates one of my criteria, I would rather spend that same time evaluating another business that clears the bar more cleanly.
This discipline is a key part of how I filter for high-quality growth stocks with the potential to compound meaningfully over the long term.
Criteria 1: Circle of Competence
"Everybody's got a different circle of competence. The important thing is not how big the circle is. The important thing is staying inside the circle"
-Warren Buffett
I strongly believe in investing only in companies or industries you genuinely understand.
It is easy to claim competence when a stock is performing well. The real test comes when the stock is down 50% or more and you are forced to make an objective decision on whether to continue holding (or adding more capital) while the market consensus turns decisively negative.
That moment exposes whether you understand the business, or whether you were merely riding momentum.
So how do you determine if a stock truly sits within your circle of competence? I use the following guidelines, ranked in descending order of reliability:
- Have you worked in the same or a closely related industry?
- Do you use the company’s products regularly and understand them deeply?
Do you have access to people or information sources within the industry that you consistently keep up to date with?
The strongest and most reliable source of competence is the industry you work in.
I have lost count of how many times I've heard doctors investing in Nvidia or ASML without understanding how semiconductors actually work. Even I have avoided semiconductor stocks entirely, despite spending the last nine years working in technology as a Solutions Engineer (My expertise sits primarily in software, cloud, and the application layer, not at the semiconductor level)
There are many excellent medical technology companies such as ISRG or MEDP that would be far more intuitive for doctors to analyze deeply. As a sidenote, long-time subscribers will know I have flirted with ISRG before. I have deliberately not added it to my watchlist yet because I lack intimate, practitioner-level insight into its competitive advantages versus players like Medtronic or Stryker (More on moats in the next section).
The second source of competence comes from being a regular product user. This sits lower on the reliability ladder because product affinity can easily cloud judgment.
For example, I am a huge fan of Singapore Airlines and fly them frequently. Yet I have little understanding of critical business drivers such as fuel hedging, aircraft fleet economics, or route-level profitability. Loving the product does not mean understanding the business.
That said, being a user still offers a modest edge over non-users. Every business ultimately starts with the customer experience. Product quality feeds into demand, pricing power, and top-line revenue before it ever shows up in margins or cash flow.
I have intentionally listed the third source of competence and effectively crossed it out. In my experience, this is the most dangerous category.
Merely reading about a company or industry is usually not enough. There are rare exceptions where someone is deeply obsessed and follows an industry daily for years. Most of the time, however, this category breeds overconfidence. People believe they understand far more than they actually do.
Be extremely cautious here. Do not force competence where you do not have a real edge.
Why is circle of competence so important?
Because when bad news hits a stock or its industry, only deep business understanding allows you to determine whether the market’s pessimism reflects a temporary dislocation or a permanent impairment to intrinsic value.
Without that understanding, volatility feels like risk and investors react emotionally. With it, volatility becomes information. You can assess whether unit economics, competitive positioning, and long-term cash generation are genuinely compromised or merely obscured by short-term noise.
When the issue is temporary, these periods often represent the highest-quality source of alpha. Capital deployed when the market is aggressively de-risking a stock tends to secure superior entry prices, setting up stronger long-term CAGR once fundamentals reassert themselves.
Criteria 2: Moat/ Product USP
In this earlier article, I covered why the first and most important filter in my process is determining whether a company possesses a true Product USP or competitive moat. This is the criterion where I spend the most time, and in the majority of cases, I disqualify a company here without even evaluating the remaining seven criteria.
In assessing this criterion, I focus on three core questions:
- What are the core products / services?
- How does their business model actually work?
- What is genuinely special or difficult to replicate about (1) and (2) that allows the company to raise prices over time or sustain long-term free cash flow generation?
If a business truly has a moat, you should be able to explain its differentiation versus competitors clearly and concisely in one to two sentences using the framework above. If you cannot, that is usually a red flag.
As a concrete example, I recently met a founding engineer from Palantir and pressed him, as a solutions engineer myself, on what Palantir does differently from other enterprise software platforms. I was particularly interested in AIP and Ontology. Despite multiple attempts, he was unable to articulate sustainable differentiation in a way that convinced me there was a durable moat.
Palantir will likely continue to perform well in the stock market over the next few years, especially given its position as an AI poster child. However, for long-term holds of ten years or more, I struggle to identify a moat beyond government contract relationships and switching costs, which I will cover shortly. For that reason, I am comfortable passing.
This highlights where my focus lies: moderately high but predictable returns, rather than significantly higher but far more uncertain outcomes.
Once I determine that a company possesses something genuinely unique, I then break its competitive advantages into four moat quadrants,
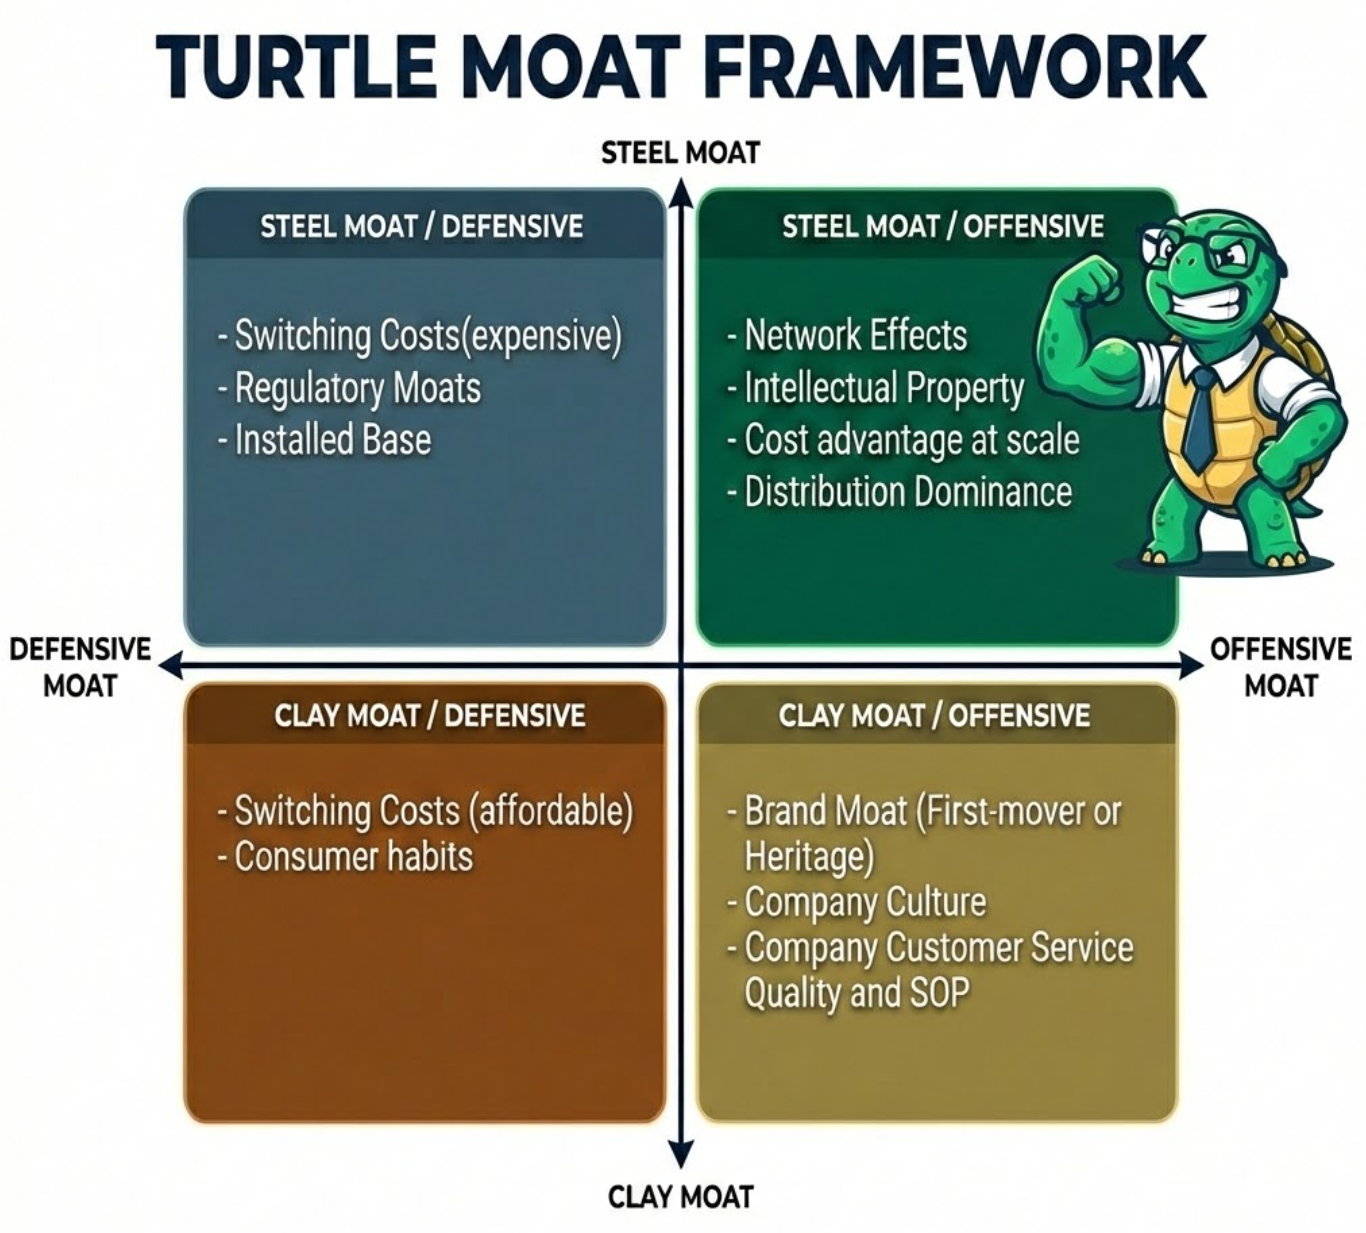
- Steel Moats: "Hard Moats"
- Steel moats, as the name suggests, are structural, systemic, and slow to erode. They are usually capital-intensive, regulated, or embedded deeply into customer workflows.
- Clay Moats: "Soft Moats"
- Fragile and relies heavily on customer perception, culture, and consistent execution. Like Clay, they must be continually shaped and maintained by management
- Offensive Moats:
- Offensive moats can be actively leveraged to win new customers. They tend to involve innovation, expansion into adjacencies, and mechanisms that allow a company to proactively grow market share.
- Defensive Moats:
- Defensive moats primarily protect existing customers and revenues. They are often used to retain, upsell, or extract value from an installed base and typically require less innovation to maintain.
My preference is Steel over Clay, and Offensive over Defensive.
Under the Turtle Moat framework, the strongest companies are those that possess an offensive steel moat, because this combination implies the ability to expand market share through innovation while earning strong and sustainable returns on capital.
Axon is an example of a company with an offensive steel moat (See this article for a deep-dive)
- Intellectual Property - Tasers have gone through more than 30 years of iteration and refinement, making them difficult to replicate. They often serve as the entry product that opens the door to new law enforcement relationships.
- Network Effect - Axon’s Evidence Cloud ecosystem becomes more valuable as more law enforcement agencies, prosecutors, and federal bodies participate. Shared access to digital evidence reinforces adoption.
Companies can, and often do, possess moats across multiple quadrants.
For example, in addition to its offensive steel moats, Axon also benefits from:
- Installed Base - Axon holds roughly 95 percent market share in Tasers and about 85 percent in body cameras across US law enforcement. This installed base allows Axon to upsell Officer Safety Plan subscription bundles with high incremental margins.
- Switching cost (Steel) - Replacing Axon’s non-lethal weapons and evidence systems would require costly retraining, operational disruption, and legal risk for agencies, making switching economically and operationally unattractive.
Defensive Steel Moats
Companies that quintessentially represent a Defensive Steel moat are those protected by regulatory credentials, such as the credit rating agencies S&P Global and Moody’s. Their products exhibit little to no innovation and depend heavily on regulatory and compliance frameworks remaining intact. Because regulation tends to change slowly, these companies enjoy a form of institutional “badge” that allows them to raise prices and maintain cash flows for extended periods of time.
Personally, I am less drawn to businesses that rely predominantly on regulation to earn their returns. I prefer companies that exhibit a degree of restlessness, where competitive advantage is earned through continuous improvement rather than regulatory shelter. In my view, consistently raising the bar in customer outcomes is a more durable way to sustain pricing power without eventually running afoul of regulators or customer dissatisfaction.
Switching Costs
This brings me to switching costs, which is one of my least favored moats.
My discomfort stems from the idea that customers are often forced to remain on a platform regardless of product quality, simply because their data and workflows are entrenched. At the risk of upsetting some readers, the most obvious example that comes to mind is Salesforce.
As a solutions engineer who uses Salesforce regularly, I find the product experience poor. The codebase is unwieldy, workflows are clunky, and the overall developer experience leaves much to be desired. This is not obvious to non-technical users, which reinforces the importance of operating within one’s circle of competence. Since acquiring Slack, Salesforce has delivered little in the way of meaningful integration, reinforcing my impression that parts of its strategy, including high-profile M&A (like hiring Matthew Mcconaughey as "Creative Advisor") , are more performative than substantive.
My broader concern is that companies that over-rely on switching costs without meaningfully improving their products eventually invite disruption. For that reason, I strongly prefer businesses that possess at least one additional moat beyond switching costs alone.
Two Types of Switching Costs
Not all switching costs are created equal. I broadly classify them into affordable and expensive switching costs.
Affordable switching costs involve workflows that are relatively shallow and technically replicable. Customers stay largely due to inertia rather than prohibitive cost. Companies like Salesforce and Monday.com fall into this category. Building a functional CRM/workflow platform is not especially difficult, especially in an era of AI-assisted development (I could probably replicate a similar CRM over a weekend and build a service called 'Turtleforce'). The primary obstacle is not technology, but customer willingness to expend effort migrating data and retraining teams. In most cases, there are few direct costs to switching beyond contractual terms.
Expensive switching costs, by contrast, involve deep workflow integration, regulatory complexity, or meaningful financial penalties.
The top examples are the Cloud infrastructure providers such as AWS, Microsoft Azure, and Google Cloud, where data egress fees (i.e. toll charge for sending data out of their cloud) are costly and operational complexity is far higher than shallow depth companies like Salesforce/Monday.com
In these cases, switching is not merely inconvenient. It is economically and operationally prohibitive.
Offensive Clay Moats
The lower-right quadrant of the framework contains Offensive Clay moats, where brand and culture dominate. These are offensive because having a good brand, strong culture and effective management often results in great go-to-market execution - aggressively winning new deals and/or expanding market share.
Brand moats are frequently abused, particularly in retail. There is a meaningful difference between brands like Hermès, Lululemon, and Nike, even though they are often discussed in the same breath. I tend to favor heritage brands with century-long histories that can't be replicated (you can't replicate the long passage of time). Hermès is the clearest example. Its European heritage and family stewardship over six generations confer an ability to sustain premium pricing in a way that newer brands struggle to match.
Company culture is even trickier. It requires studying management behavior over time, reading interviews, and understanding founder intent. Because culture is fragile and execution-dependent, it sits squarely in the Clay category. What constitutes a strong culture is also subjective. A culture I admire may appear dysfunctional to someone else.
Netflix is a good example. I admire Reed Hastings’ willingness to repeatedly reinvent the business, from DVD mailers to streaming to advertising, as well as the company’s emphasis on high performance standards, exemplified by the well-known Keeper Test.
After evaluating a company across all four moat quadrants, I form a judgment on whether it possesses multiple, reinforcing moats capable of compounding over time. I then use gross margins as a rough sense check, typically looking for levels above 40 percent.
That said, gross margins should never be the starting point. Software businesses often exhibit high margins due to near-zero marginal costs, but that does not guarantee durability. This is why qualitative moat assessment must come first, with financials used only as confirmation rather than proof.
I will later share a counter-example using The Trade Desk, which I exited roughly two years ago, to illustrate how strong financials alone can be misleading. This will be covered in the section on Consistently Growing Financials with a Stable Base.
Criteria 3: Secular Trend & Total Addressable Market (TAM)
As the saying goes, a rising tide lifts all boats. Beyond passing the moat and Product USP test, I strongly prefer businesses that operate within long-term, industry-wide secular growth trends.
Examples of secular trends include,
- Linear TV to streaming (e.g. Netflix)
- Physical retail to e-commerce (e.g. Amazon)
- Cash to cashless payments (e.g. Visa)
When a company with a strong moat participates in a structurally expanding industry, a dual compounding effect emerges. First, the business can continue to gain share and raise revenues through competitive advantages. Second, the overall industry itself grows over time, meaning the size of the pie expands even if relative market share remains unchanged.
The converse is equally important. I actively avoid businesses operating in industries facing long-term structural decline, regardless of how cheap the stock may appear.
Examples include:
- Alcohol companies such as Boston Beer Company - Consumption is declining among younger demographics
- Print media such as Lee Enterprises Inc. - Audience attention continues to migrate toward digital and social platforms
No amount of operational excellence can fully offset a shrinking end market over long term horizons.
Understanding TAM
It is critical to understand the Total Addressable Market (TAM) for both a company’s core business and any adjacent optional markets (which I will cover in more detail in the Optionality and Catalysts section).
A simpler question: is there enough runway for the business to compound for many years without running into a growth ceiling?
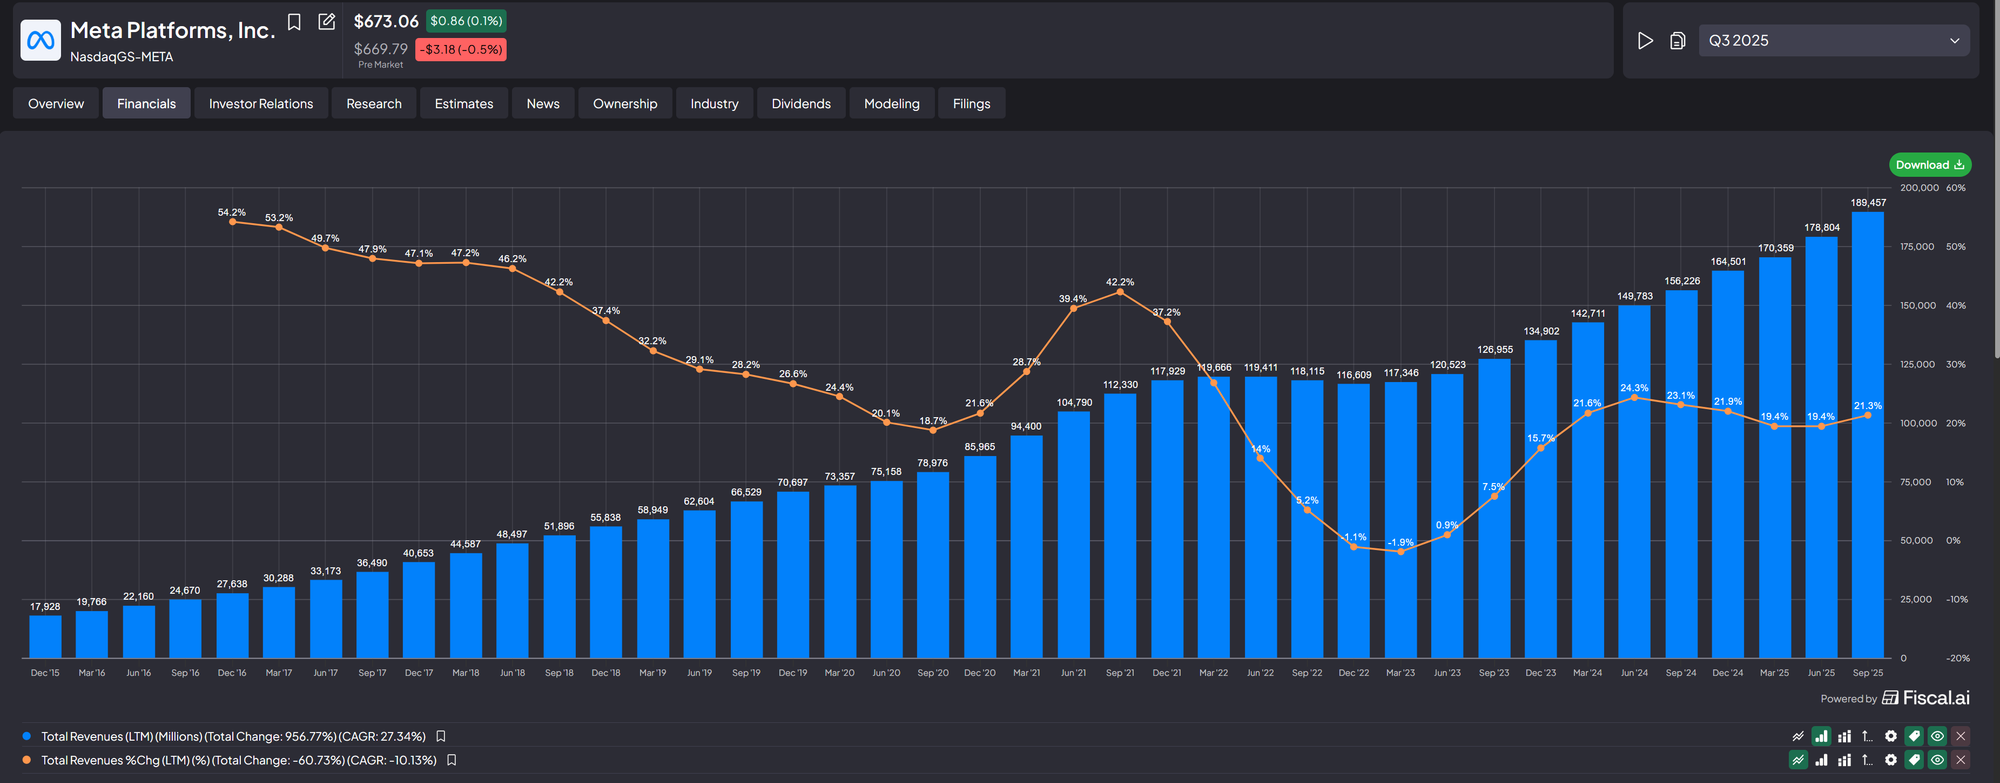
Meta provides a useful illustration. The company generated approximately USD 185 billion in last-twelve-month revenue from its Family of Apps segment. The global digital advertising market was roughly USD 690 billion as of 2024 and continues to grow at an estimated 15 to 20% annually.
This implies Meta holds roughly 20+% market share, yet still operates within a market that is itself expanding rapidly each year. In other words, Meta can continue to grow revenues even without aggressive share gains by simply holding onto whatever share it currently has!
Importantly, this TAM assessment excludes Meta’s longer-dated optionality in areas such as augmented reality (e.g. Ray Ban Meta Glasses). While the commercial viability of AR remains uncertain, successful platform adoption would represent an entirely new TAM with more room for revenue growth.
Criteria 4: Consistently Growing Financials with stable base
Once a company passes my moat and secular trend filters, I turn to financials to confirm whether the qualitative thesis shows up in the numbers. The metrics below are not exhaustive, but they form my first quantitative screen for growth companies.
Consistently growing Revenues
Because I focus on growth stocks, I generally look for at least 10 percent year-on-year revenue growth, averaged over the past five years, before shortlisting a company. My preferred sweet spot tends to be somewhere between 15–25 percent.
At the other extreme, I am cautious with businesses growing 50 percent or more, as these are often very early-stage companies with small revenue bases. Such growth is usually fragile and far more speculative than I am comfortable with for long-term holdings and the company is at a stage where it is too early to tell if it will survive long-term (unless you happen to have intimate knowledge of a USP it possesses).
Consistency is critical. I prefer a smooth, steadily rising revenue curve over the past 5-10 years, measured on a last-twelve-months basis, rather than lumpy or volatile growth. For e.g., take a look at Meta’s revenue growth chart (from Fiscal.ai) over the last 10 years below on a LTM basis (Blue bars are revenue & Yellow line is YoY growth)
Consistently increasing Profitability
For gross margins, I generally look for 40 percent or higher, ideally stable or expanding over time. This signals pricing power and structural advantage.
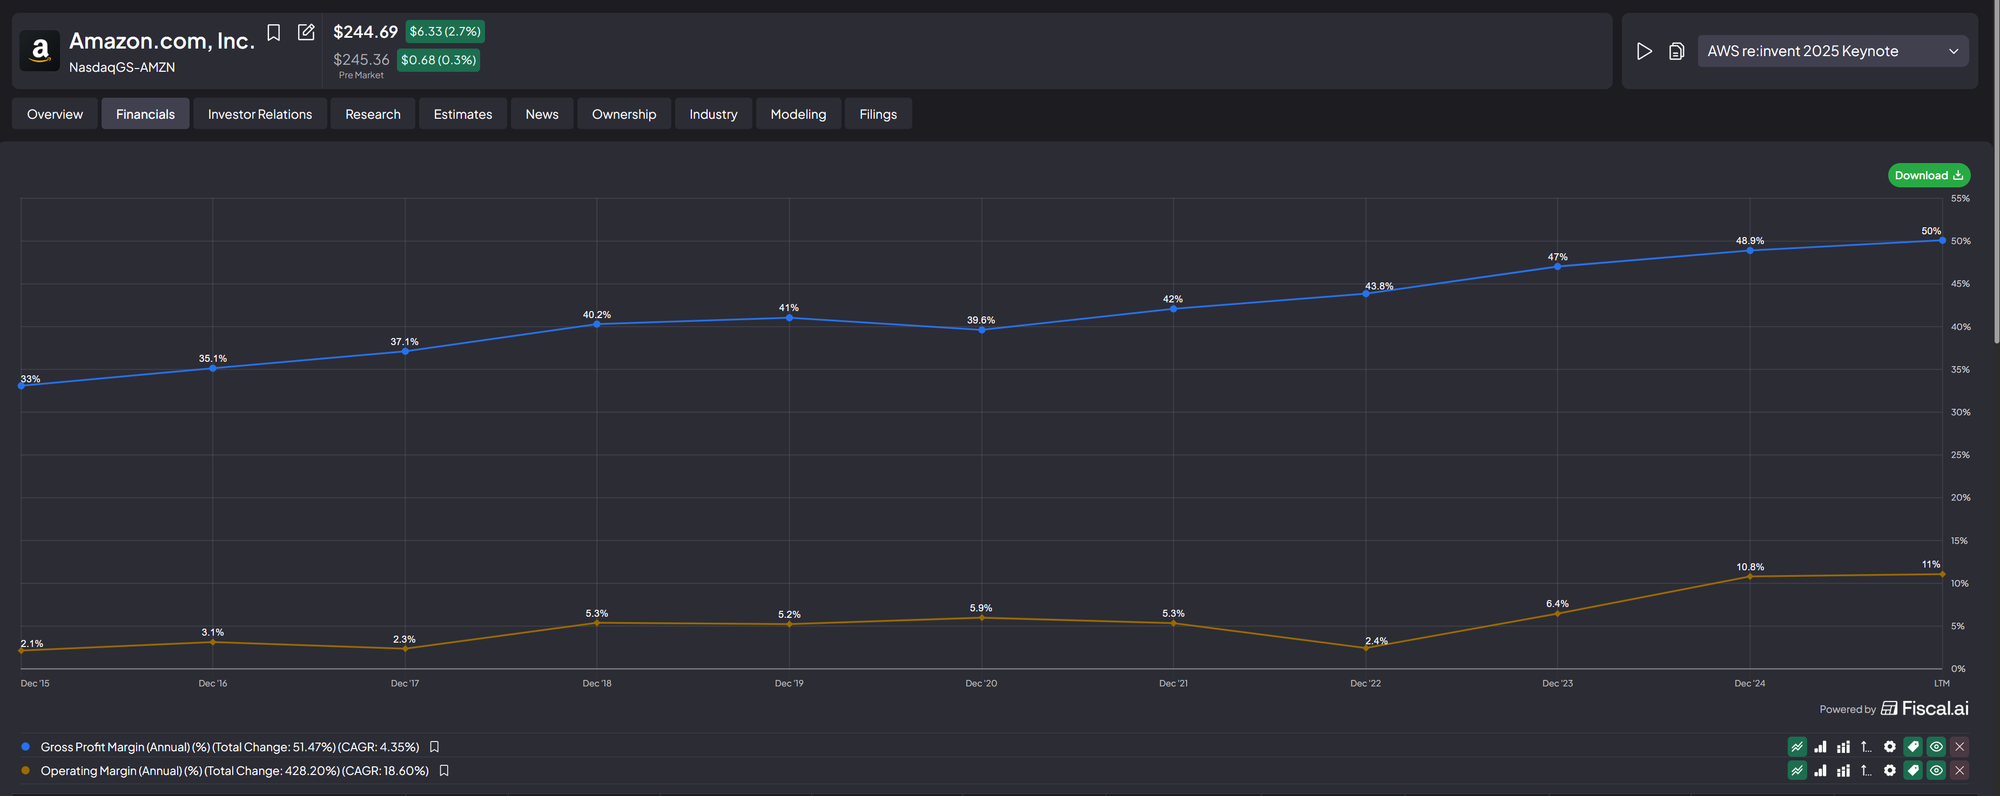
Operating margins vary significantly by industry. For example, Amazon’s core e-commerce business operates at relatively low margins due to the nature of retail: inventory costs, shipping, and labor scale with volume, meaning incremental revenue still carries incremental cost. That said, Amazon compensates through sheer scale and, increasingly, through higher-margin segments like AWS.
What matters more than the absolute margin level is the direction. I want to see operating margins improving over time, which signals increasing operating leverage. Amazon’s margin trend over the years illustrates this well as AWS becomes a larger contributor and automation reduces labor intensity.
A Caveat on Early-Stage Growth
Some growth companies do not yet show stable or rising operating margins because they are deliberately reinvesting heavily. This often shows up in:
- High stock-based compensation
- Elevated R&D spending
- Front-loaded SG&A
Among my holdings, Axon is the most speculative on this dimension. While most of my other companies show expanding margins, Axon’s operating margins have declined over the past decade.
For example, take a look at AXON's margin charts below:
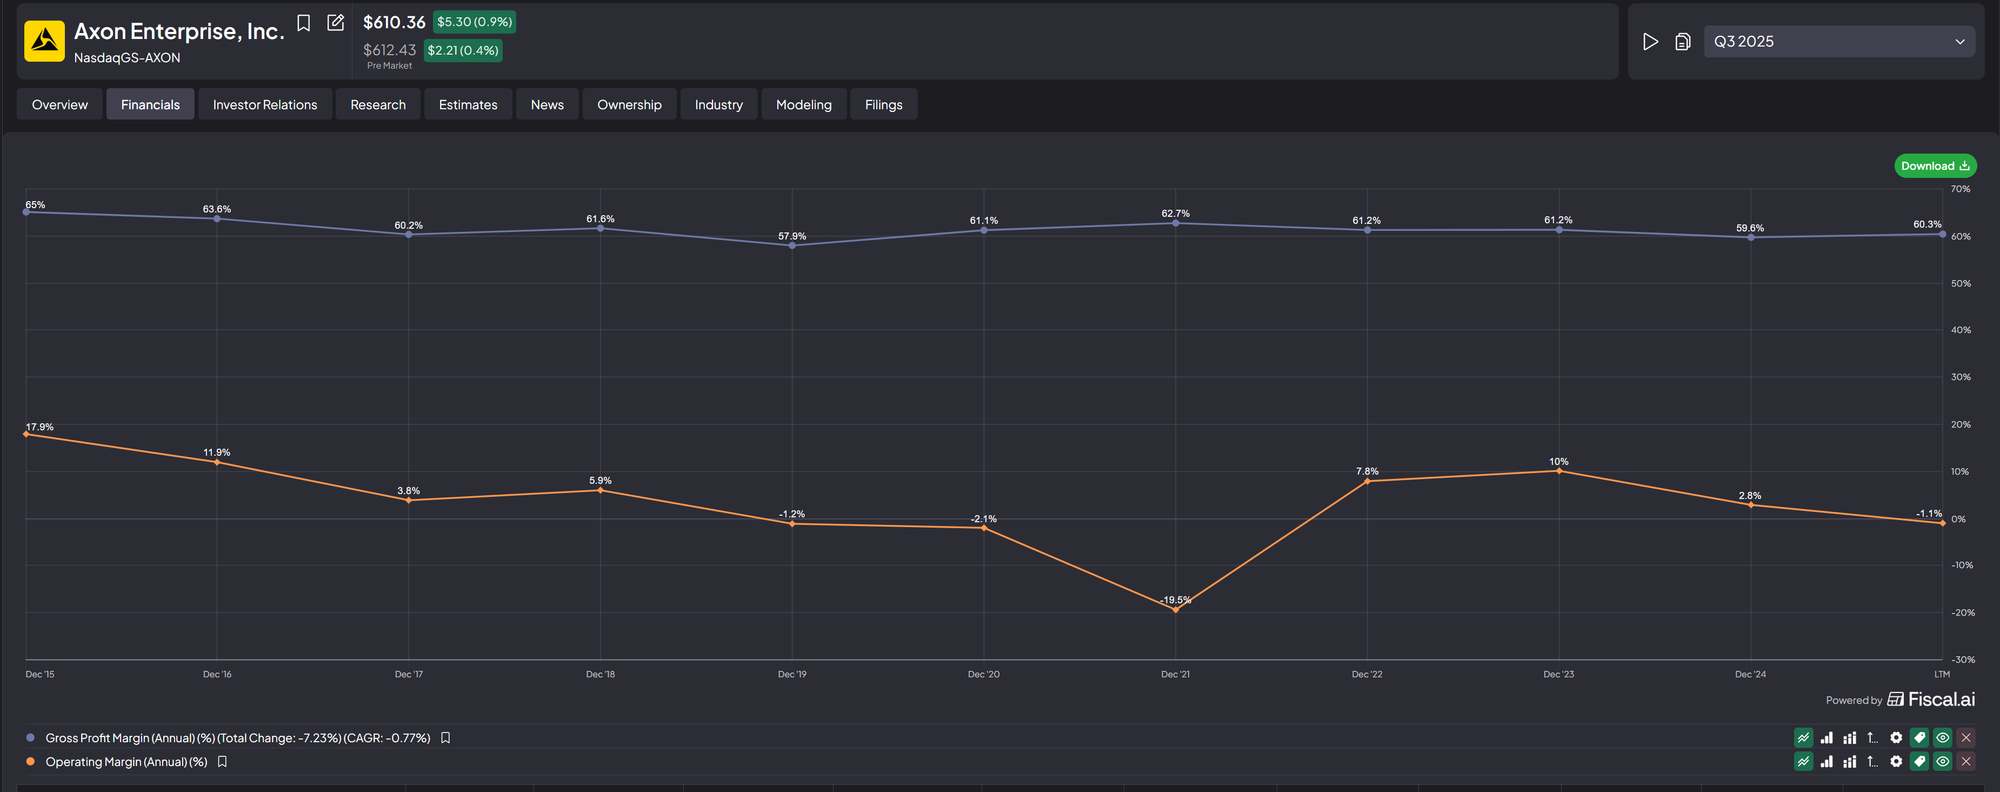
In such cases, it is critical to understand why margins are under pressure and whether there is a credible path to operating leverage.
For Axon, margin compression is largely driven by:
- High SBC required to attract and retain top engineering talent
- Elevated R&D spending as Evidence.com transitions the business from hardware-heavy sales to a software-led platform
I am comfortable with this trade-off because I believe Axon’s platform economics can eventually produce operating leverage (read my thesis here), much like Amazon in the early days of building AWS.
Consistently increasing Cashflows
There is a saying: Profit is vanity, cash is reality.
Ideally, both operating cash flow (OCF) and free cash flow (FCF) should grow consistently over time. This confirms that reported earnings are translating into real economic value and helps guard against accounting manipulation.
Mastercard’s cash flow chart over the past decade is a textbook example of this:
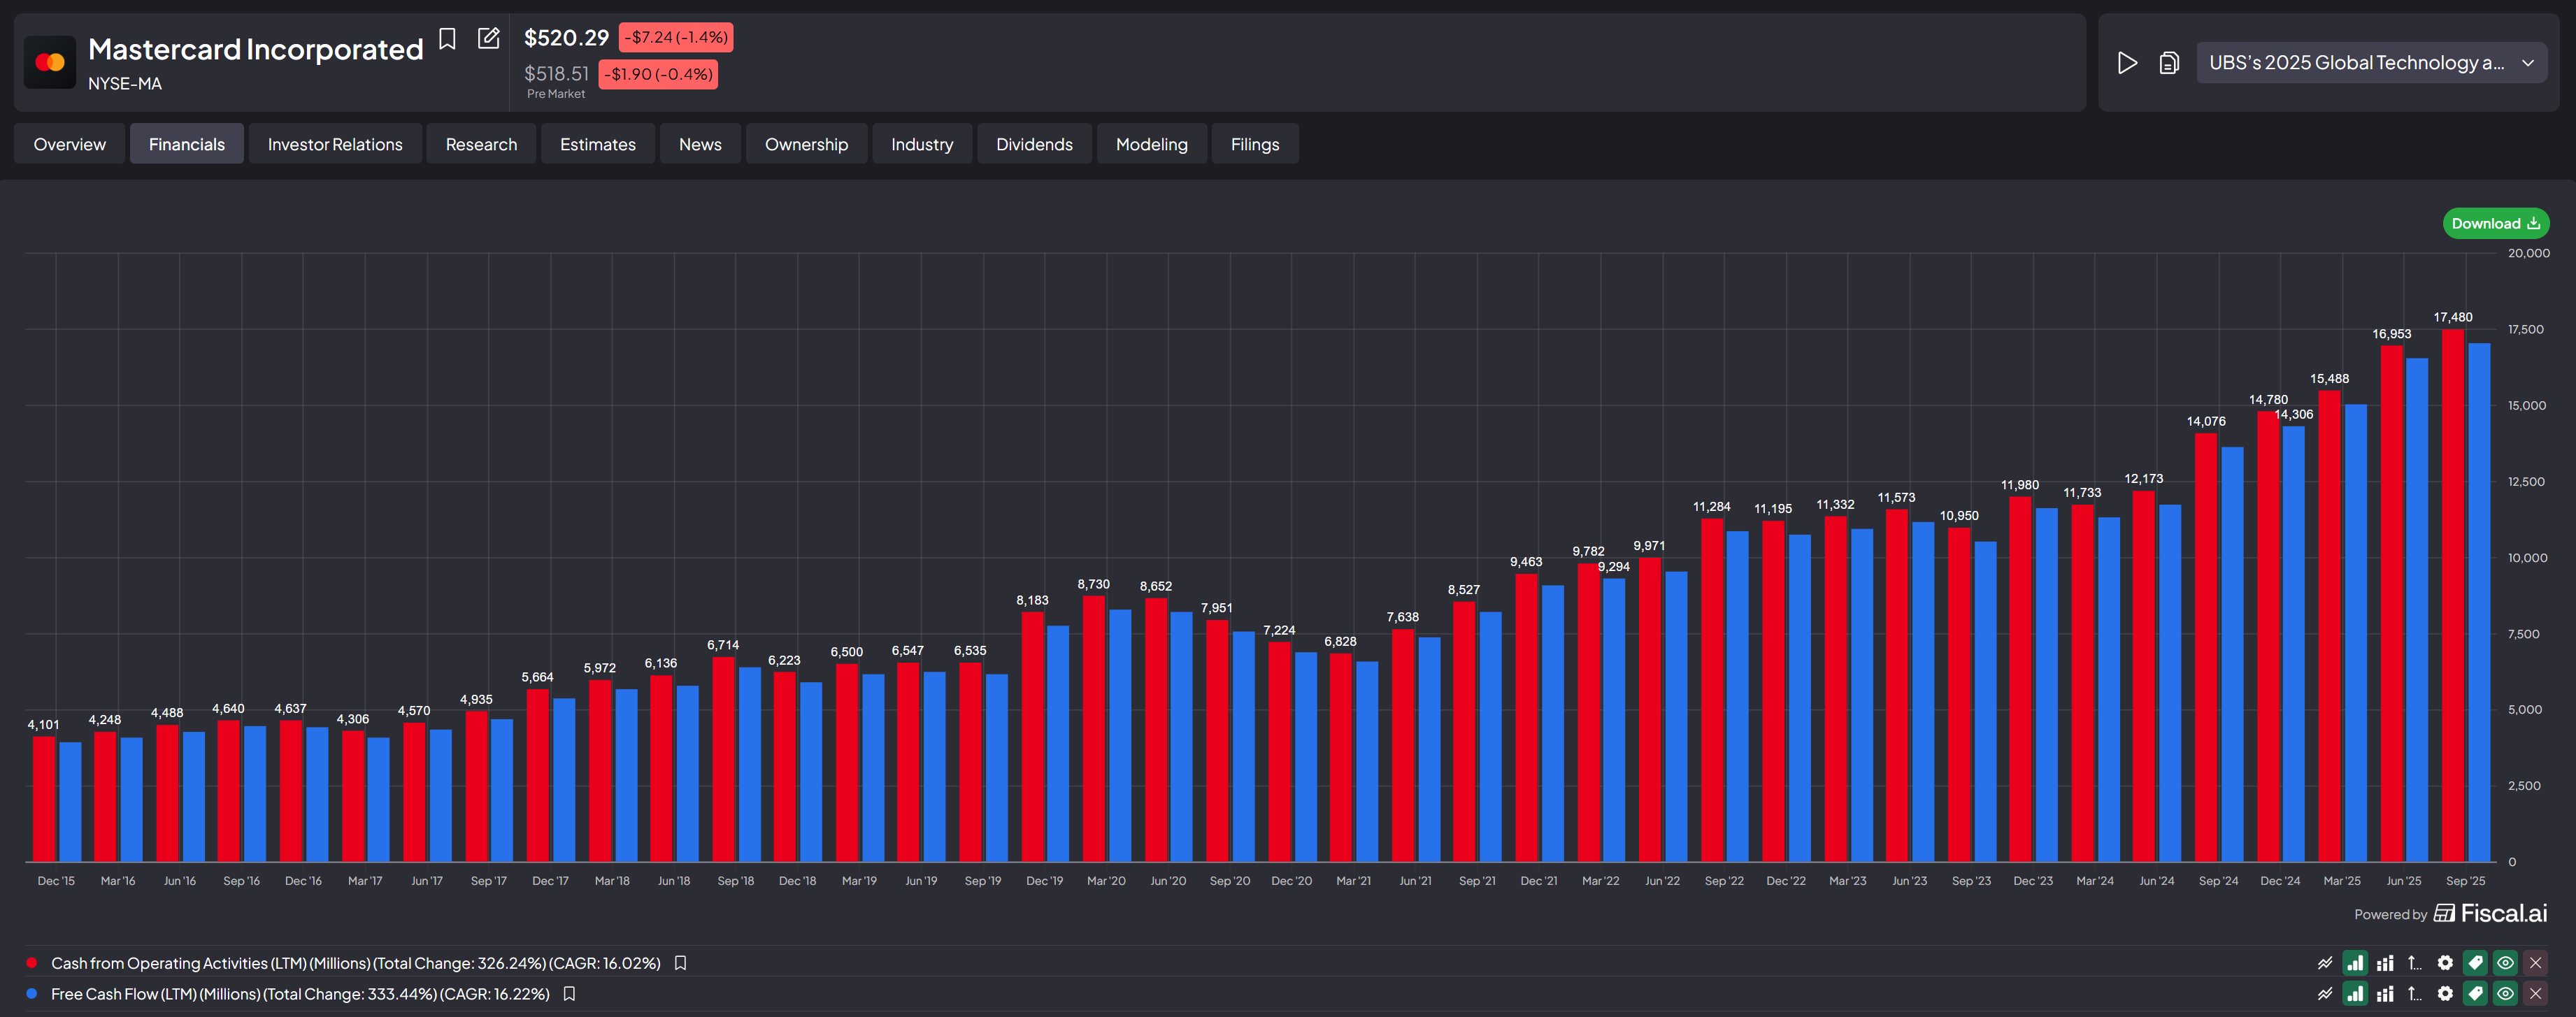
As companies mature, cash flows tend to become smoother and more predictable due to optimized margins and stable business models. However, this maturity often comes with a trade-off.
Highly optimized cash flow margins can signal that a business is later in its growth cycle. This does not mean growth is over, the payments TAM remains enormous, but it does mean outsized alpha becomes harder because the business is widely understood and future profitability is already well priced in.
Consistently growing company-specific segment financials
Beyond headline financials, I pay close attention to company-specific metrics that indicate real operating momentum. Common examples (not exhaustive) include:
- Customer, user, or subscriber counts, growing steadily over time
- Take rate, particularly for e-commerce or payments platforms rising over time
- Net Revenue Retention (NRR) for subscription businesses, where I look for 120 percent or higher as a strong signal of expansion and moat strength
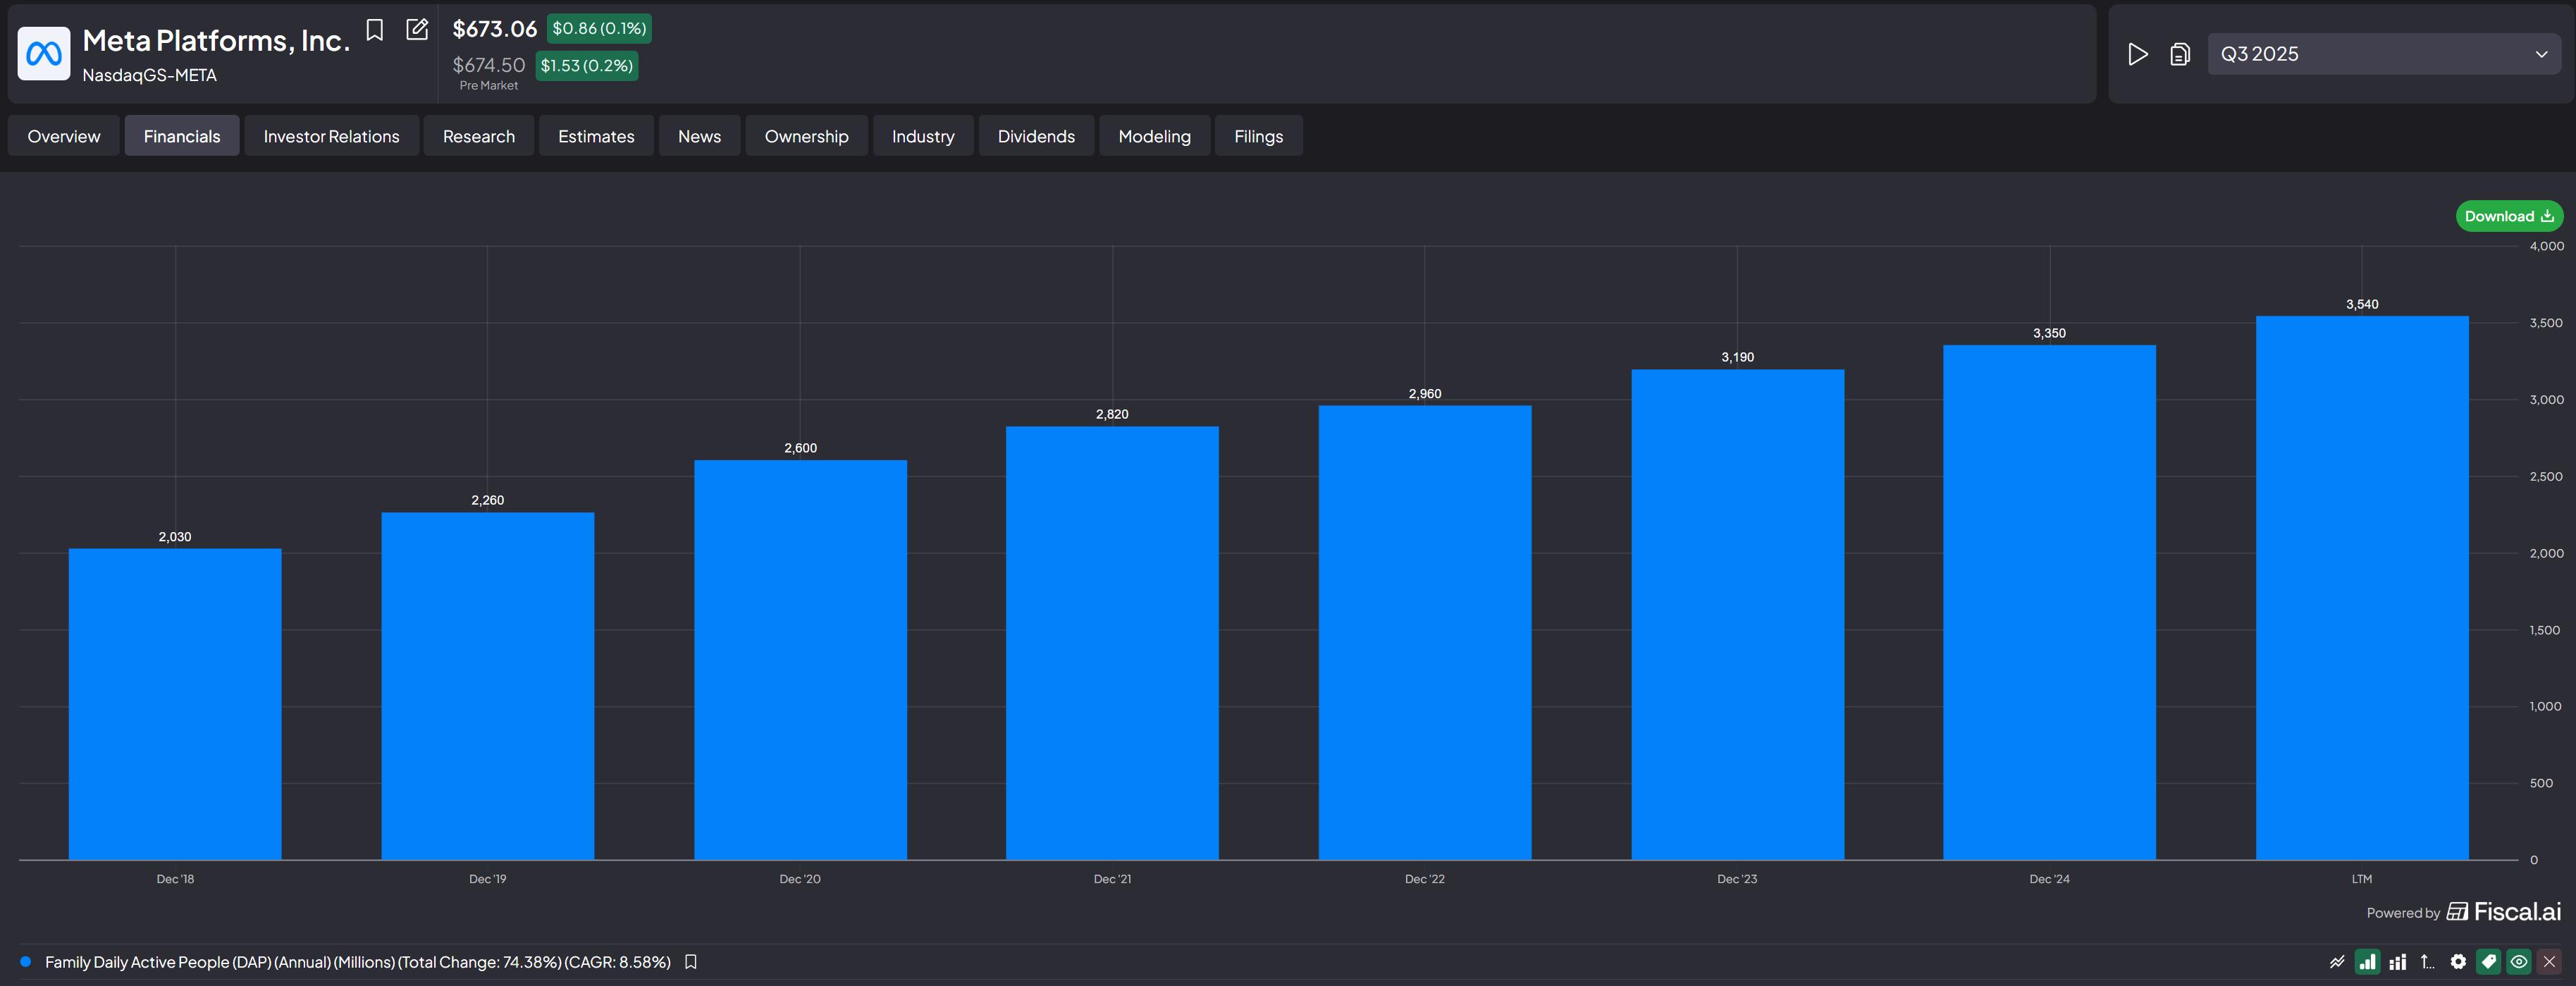
For example, Meta’s Family of Apps' Daily Active Users (DAUs) continue to grow year over year, despite already reaching more than 40 percent of the global population. That is a powerful demonstration of an offensive steel moat in the form of Network Effects.
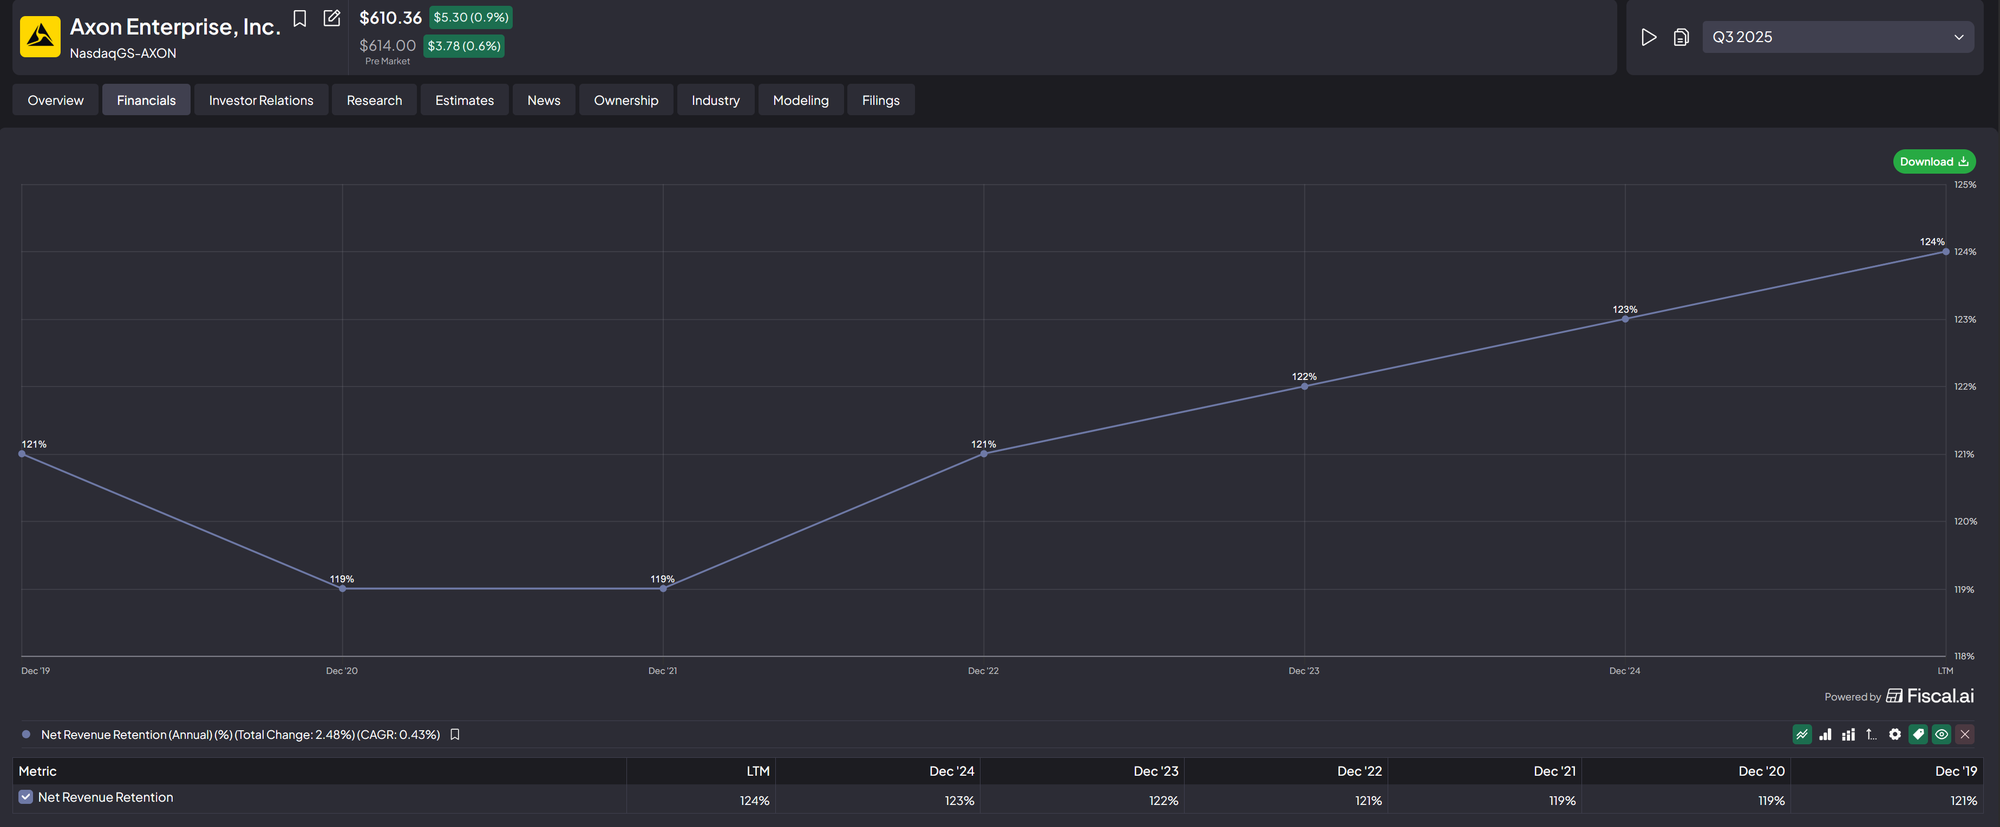
Similarly, Axon’s NRR has risen above 120 percent in recent years, implying that existing law-enforcement customers are consistently expanding spend without Axon needing to acquire new agencies - a sign of switching cost moat.
Strong balance sheet with reasonable amounts of debt
I also apply a simple balance-sheet sanity check using rough rule-of-thumb thresholds:
- Current ratio > 1, indicating the ability to meet short-term obligations
- Debt servicing ratio ≤ 30 percent, ensuring sufficient cash flow for reinvestment and downturn resilience
- Debt / EBITDA ≤ 3×, to avoid excessive leverage on the balance sheet
These are not hard rules, but they help surface obvious red flags. In special situations, such as Netflix’s acquisition of WBD, some ratios may temporarily exceed thresholds. What matters is whether the long-term economics justify the leverage and whether the company can comfortably service its obligations. In Netflix's case, I believe the company is capable of covering their long-term debt obligations on a pro forma basis.
Caveat on Financials
I deliberately analyze financials after a company passes my moat and secular trend checks. I want to first understand why the business could endure before confirming that story in the numbers.
I strongly disagree with investing approaches that rely purely on financial screens without understanding the underlying business and its products. This often fails in two ways:
- Financials are backward-looking and may not reflect future competitive shifts
- Long-term catalysts can materially alter a company’s trajectory and are often missed by short-term, earnings-focused analysis
Case Study: Why I Sold The Trade Desk (TTD)
One example I want to share is how I dodged the fall of The Trade Desk (TTD). Below is a log of my transactions and a screenshot from Tiger Brokers of when I bought and sold the company.
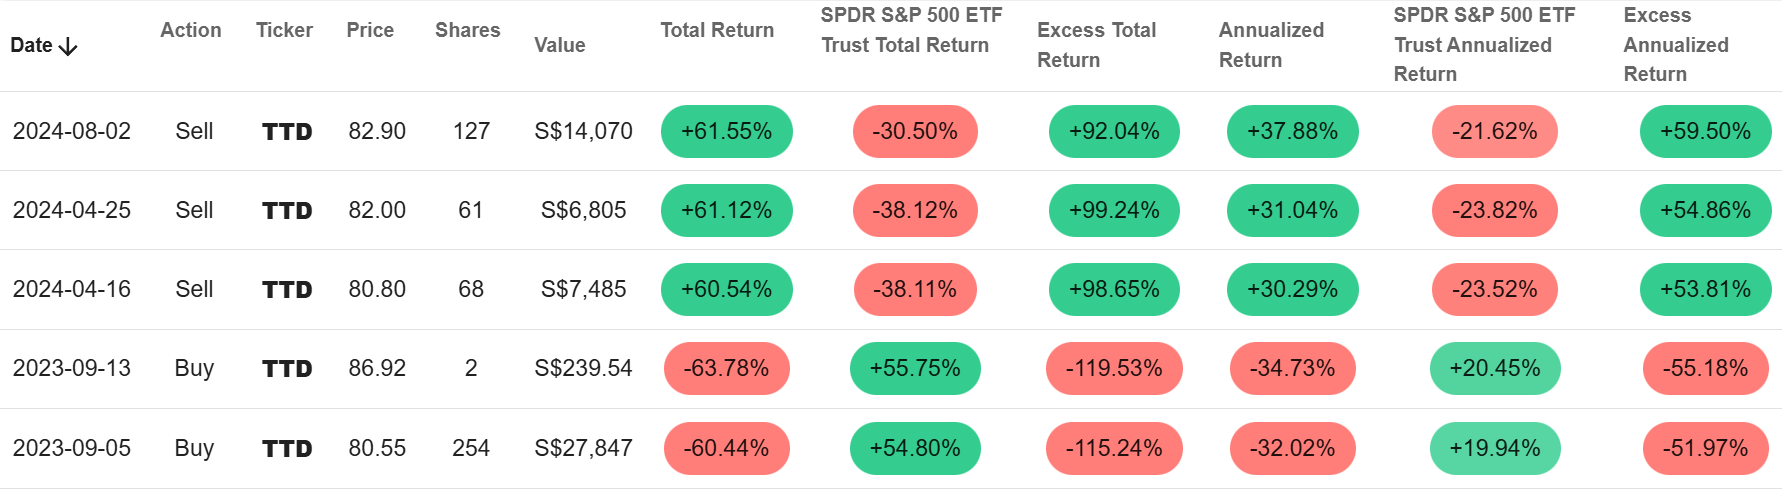
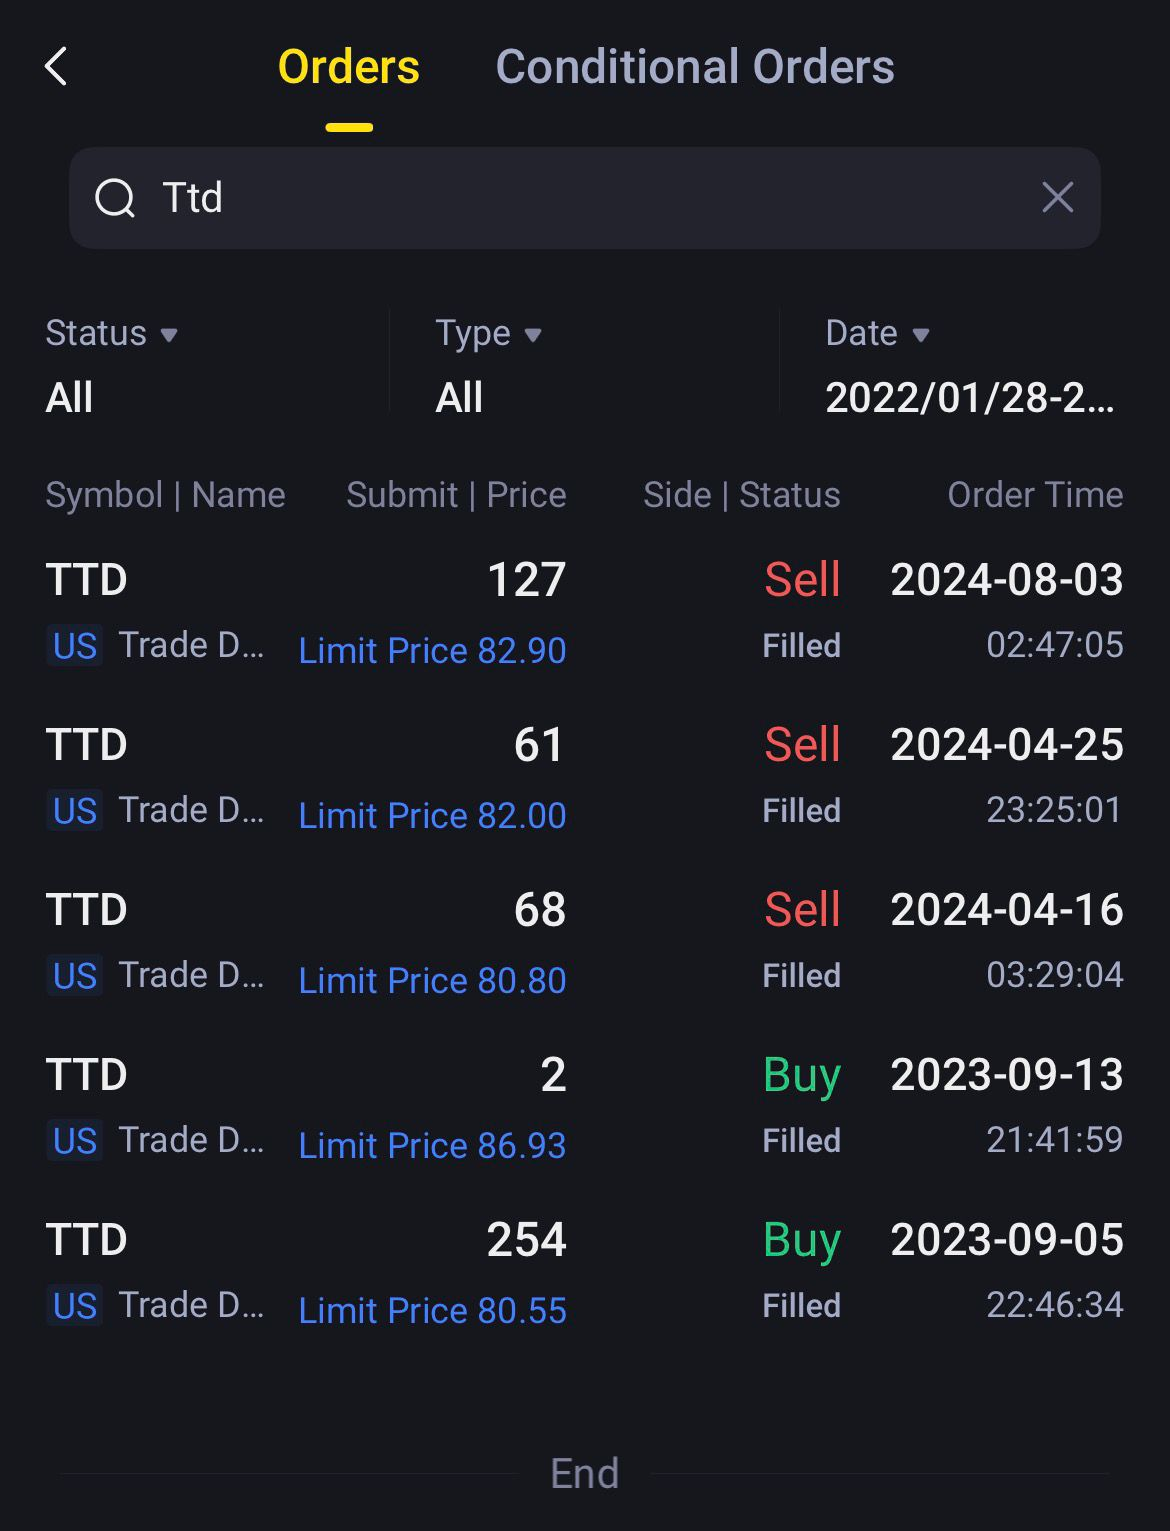
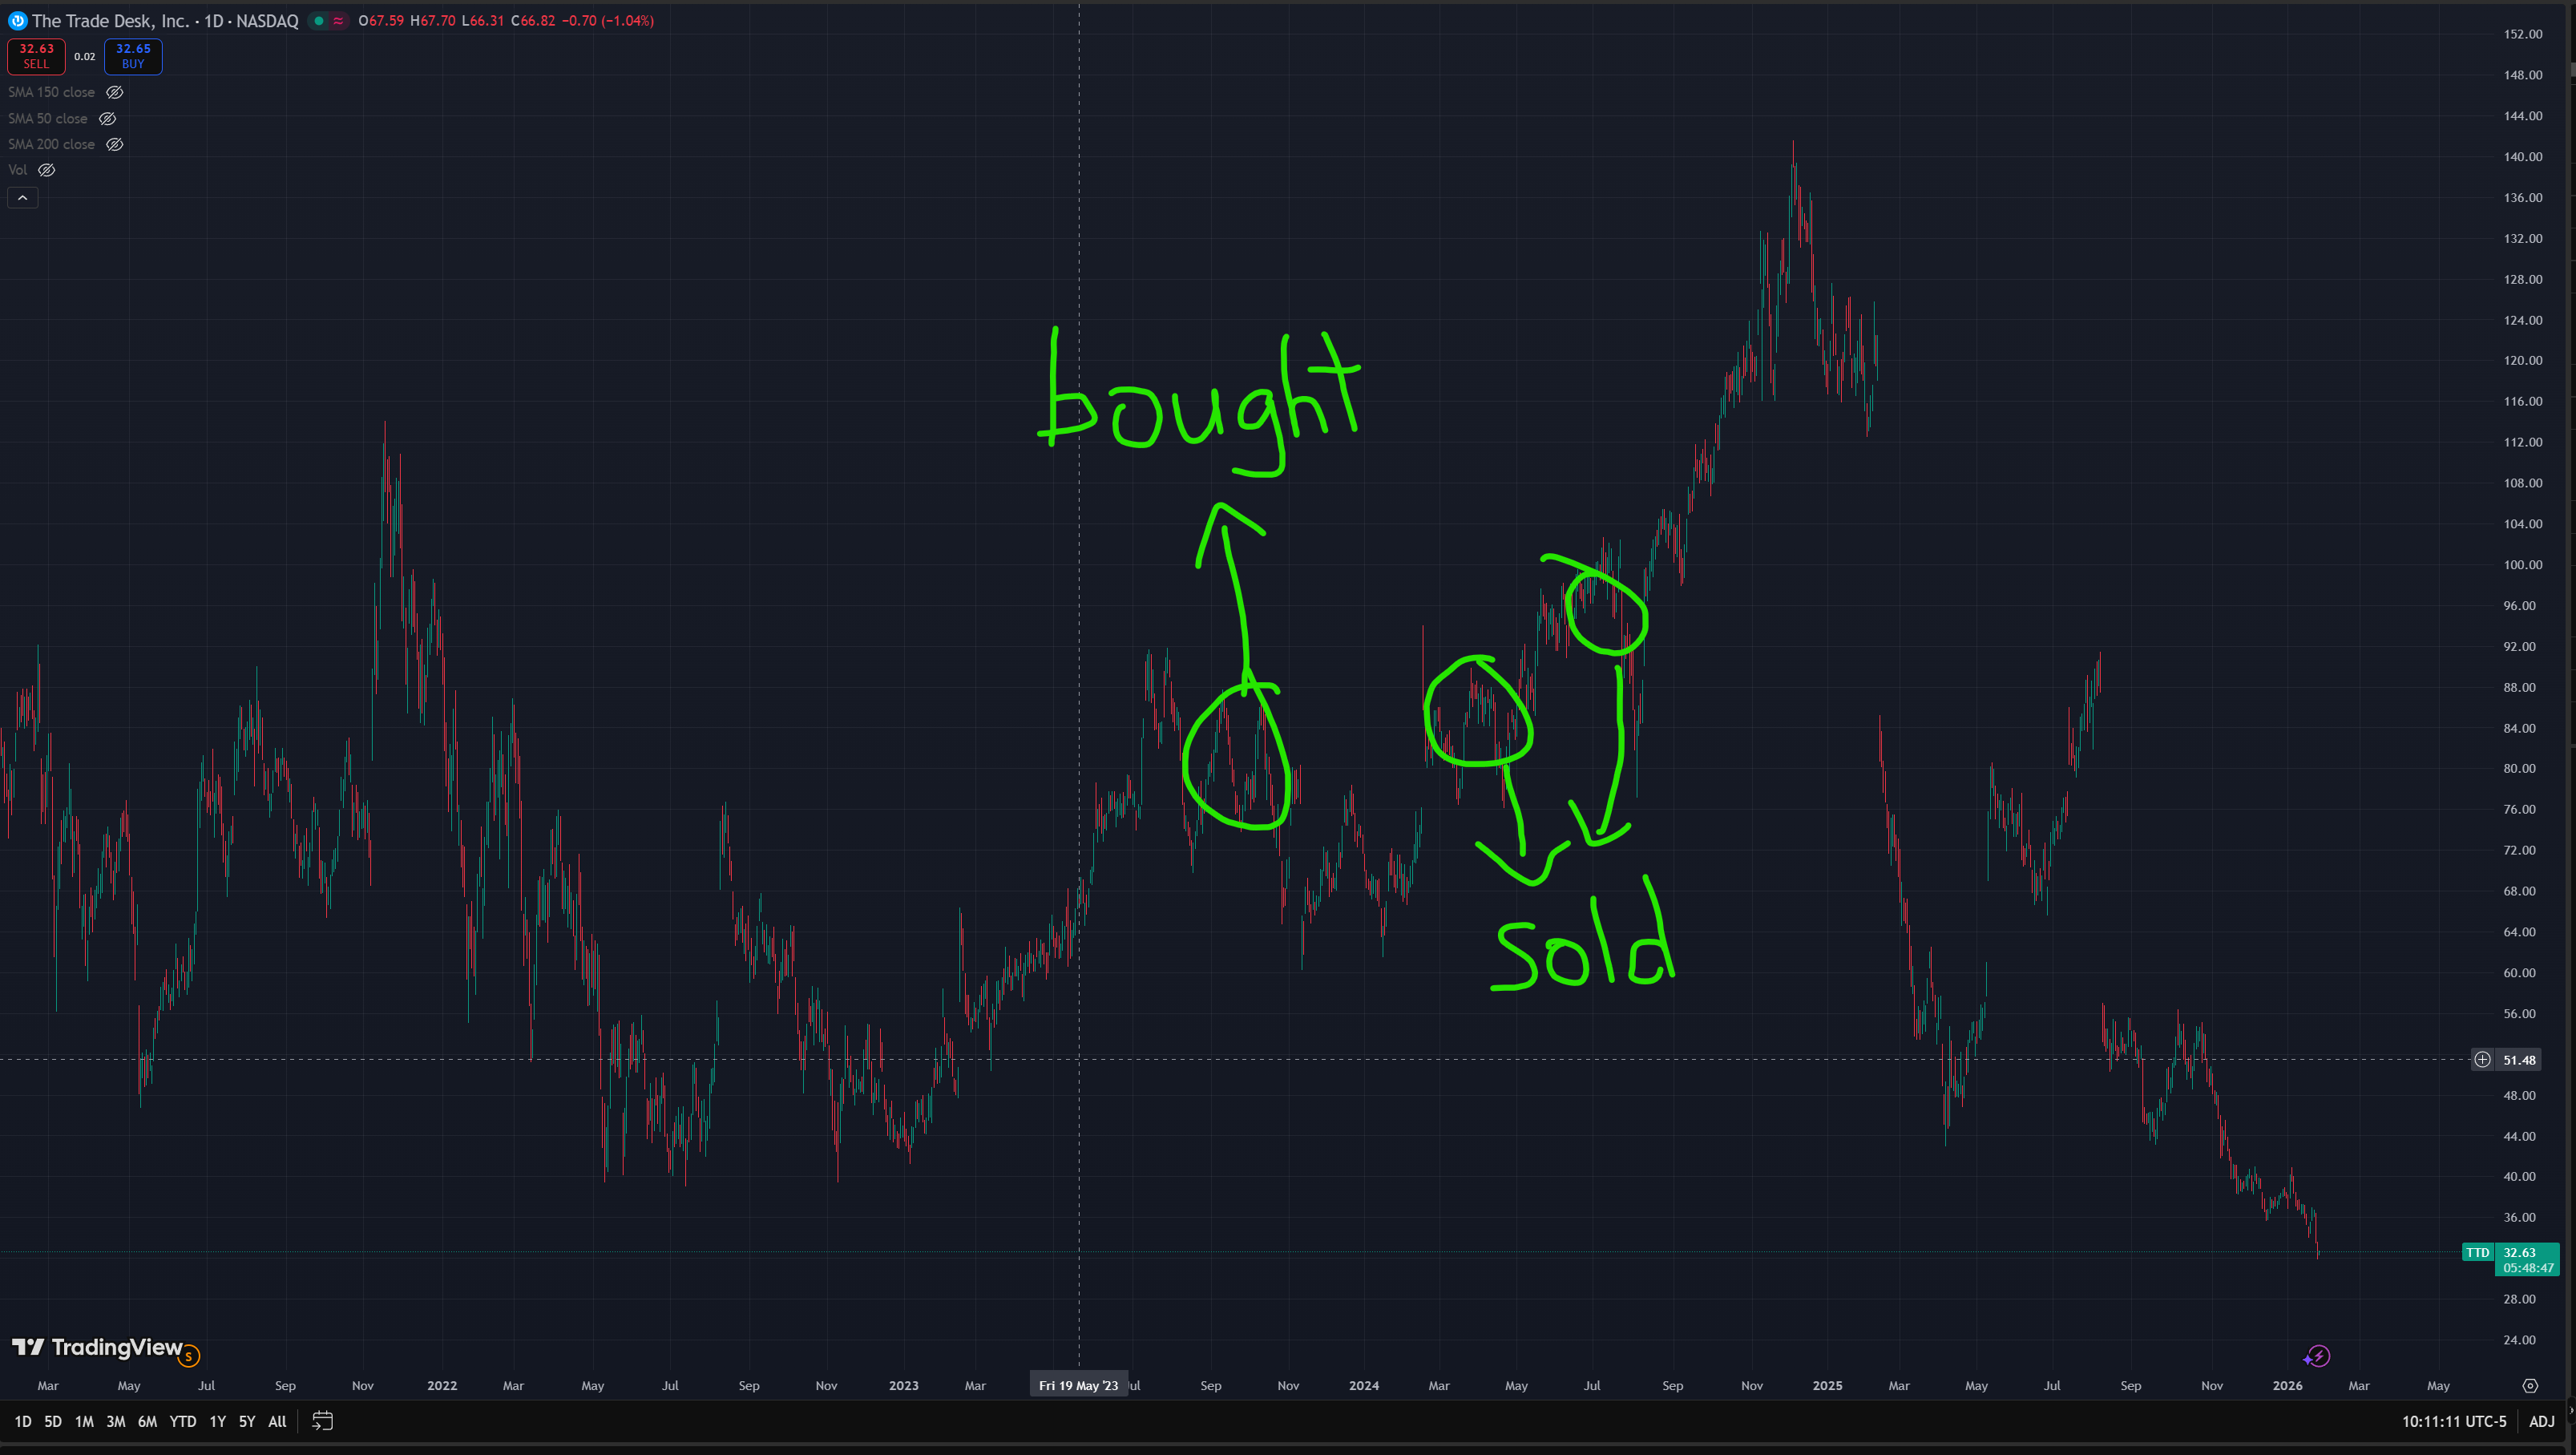
I bought TTD around USD 80–86 and sold the entire position within a year at roughly the same price, an unusually short holding period for me. Although I missed the subsequent rally to over USD 140, I also avoided the later collapse of more than 70 percent from all-time highs.
It's too early to tell if I'm right on my thesis of selling out (Let's judge in 2029, 5 yrs from my sell transaction to judge this transaction's performance), but let me share why I sold out of TTD completely.
Here are TTD's financials:
First, Revenue % growth rate (Blue line), Gross Profit Margins (Orange Line) and Operating Margins (Purple line).
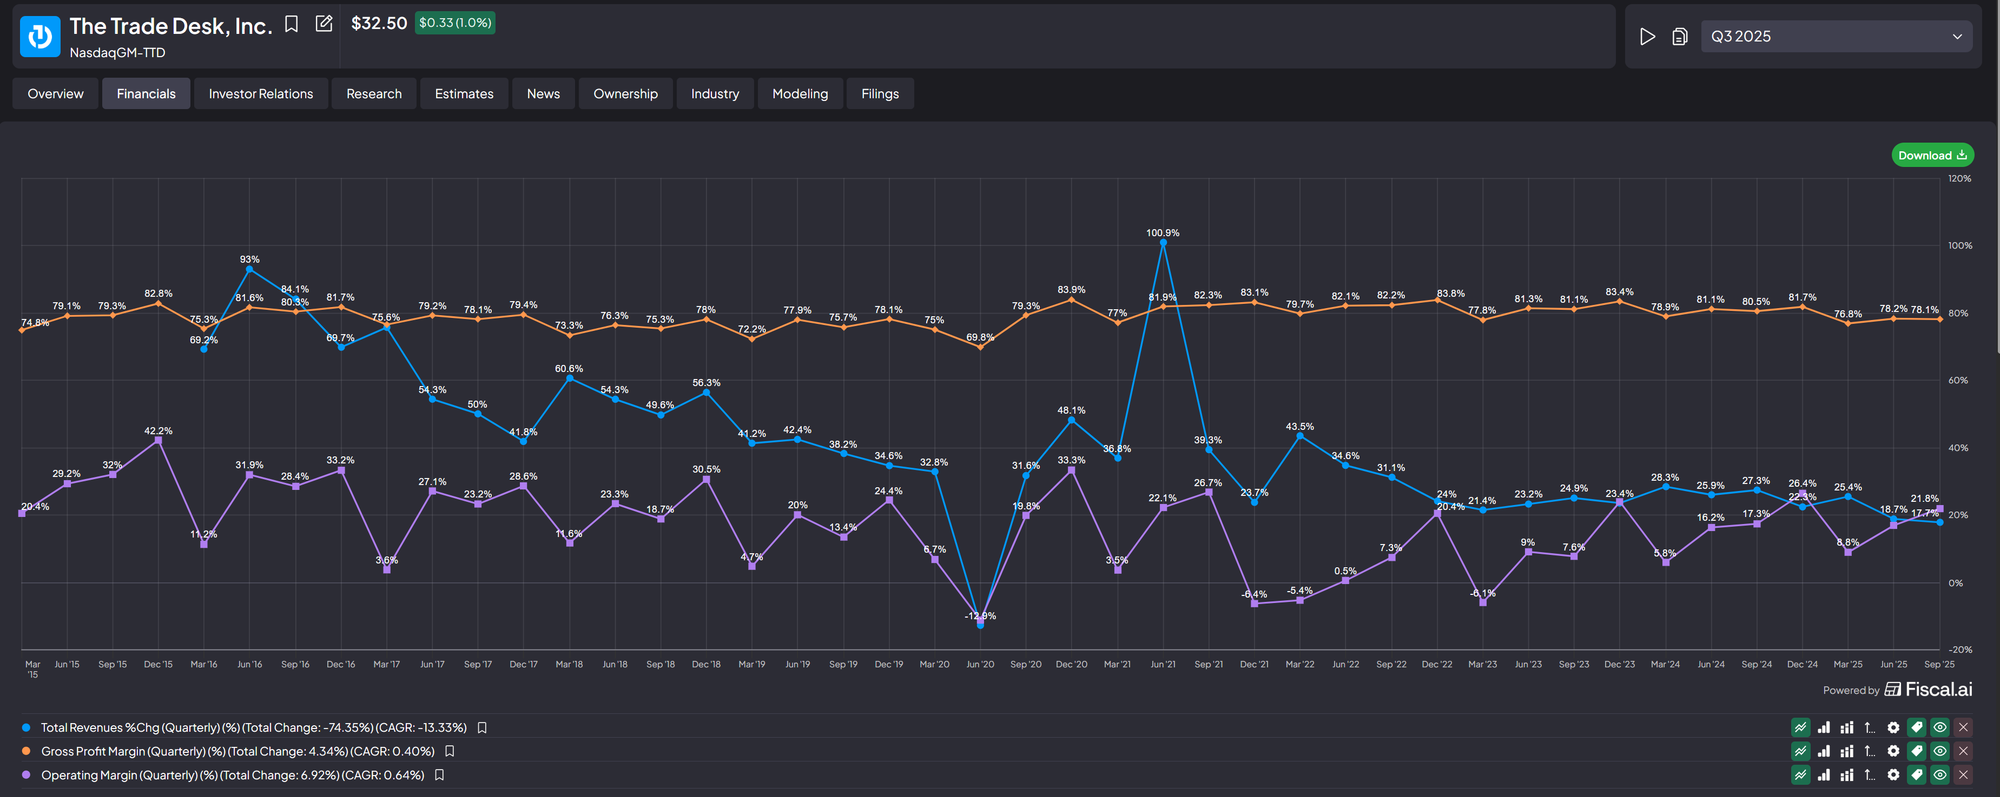
On paper, TTD’s financials looks outstanding:
- Median Revenue growth above 30 percent
- Gross margins of 70–80 percent
- Operating margins around 20 percent
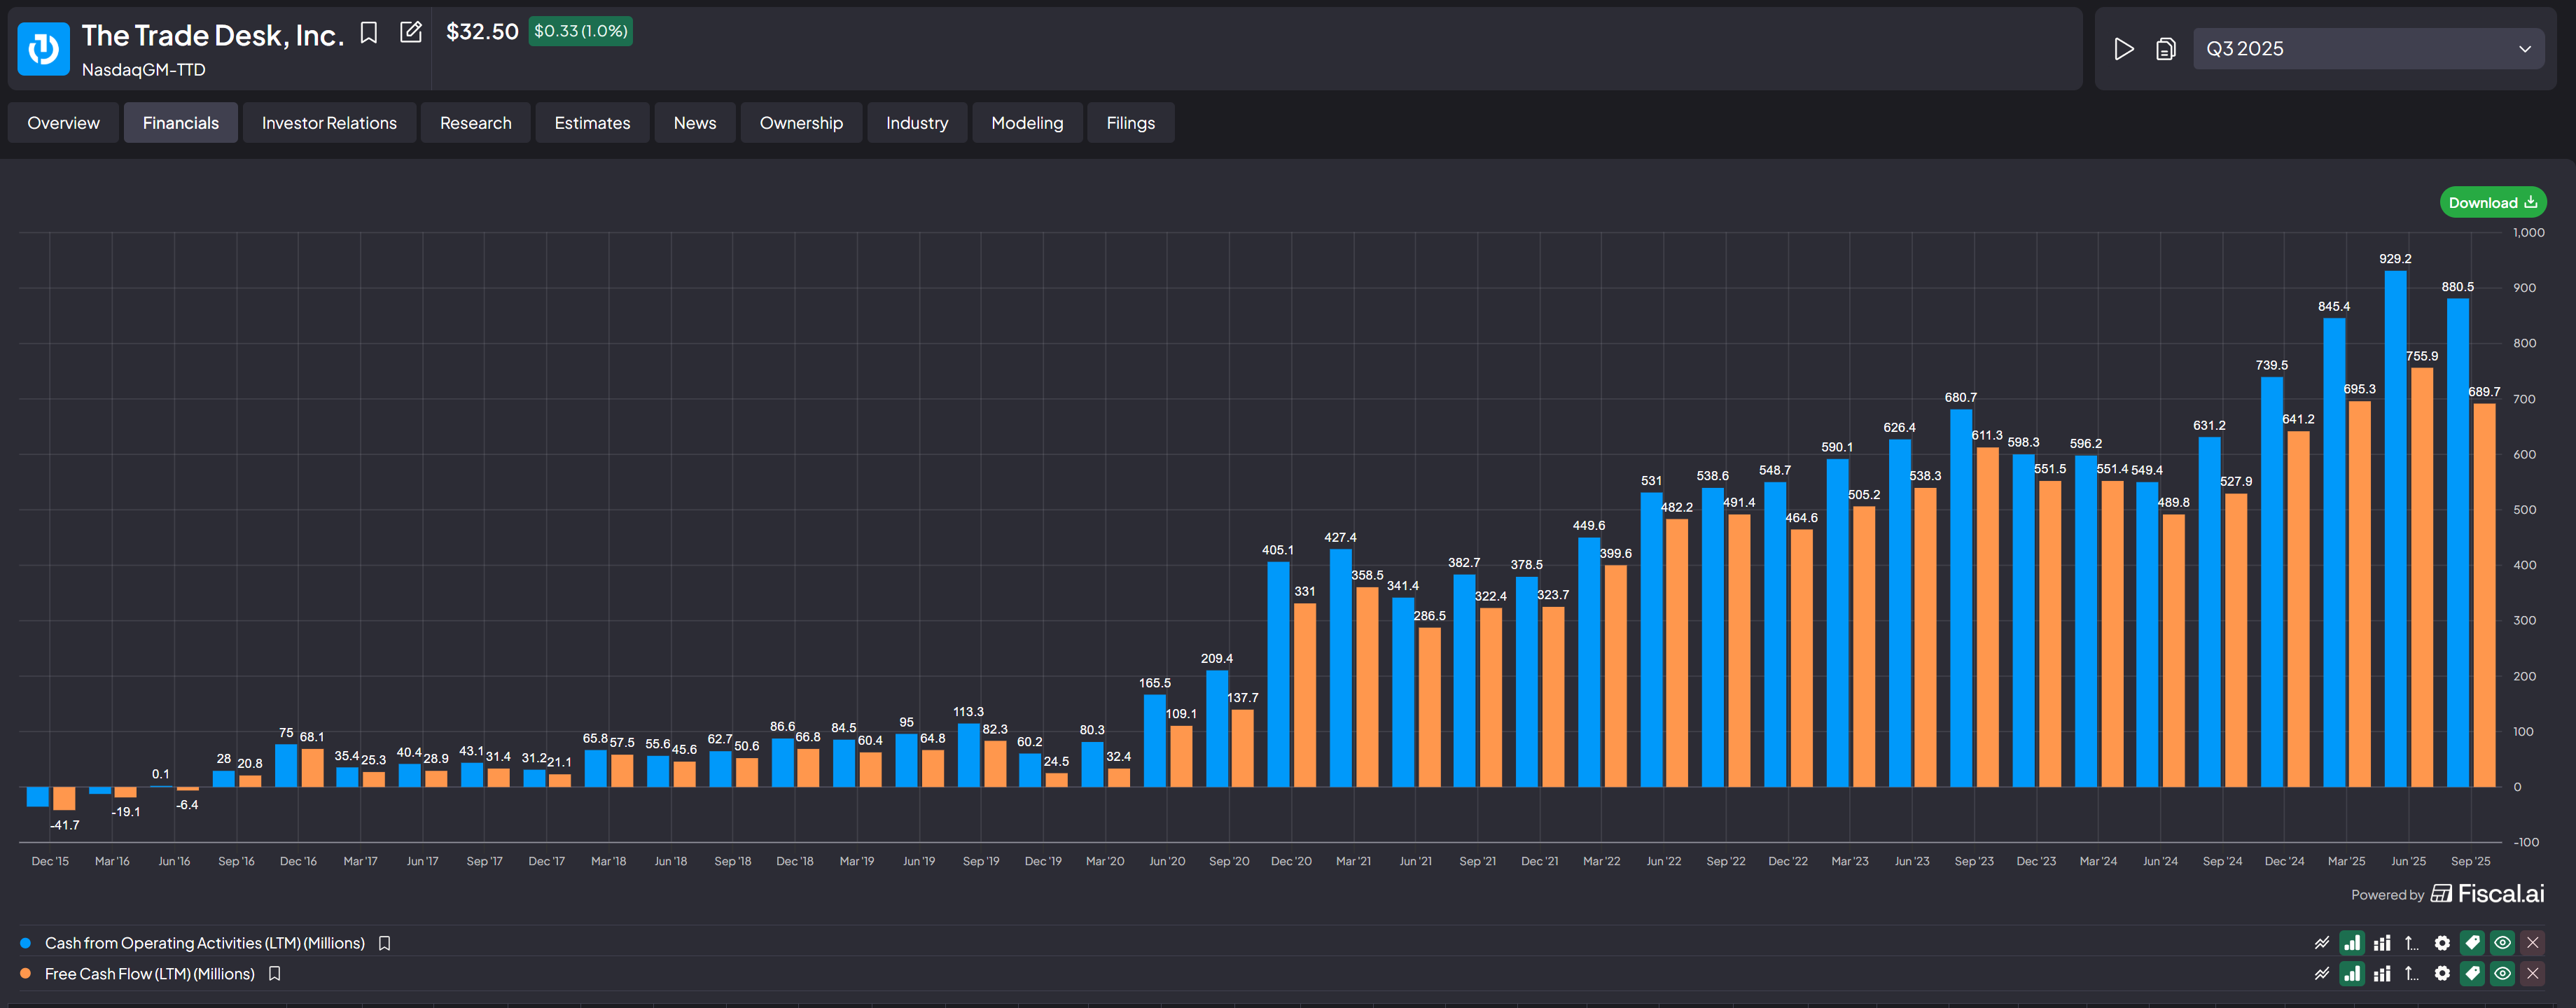
Cash flow was equally impressive, take a look at the OCF and FCF charts below over the last 10 years. Absolutely stunning.
So why did TTD's stock crash?
In mid-2025, revenue growth decelerated below 20 percent for the first time, and management commentary pointed to slower demand ahead. Given the stock’s extreme valuation, over 200× trailing earnings at one point, this triggered severe multiple compression.
However, valuation was not why I exited before the stock crash.
The real issue was a mistake in my moat assessment. Having worked in ad tech, I became increasingly uncomfortable with TTD’s DSP model, which does not own advertising inventory. TTD acts as a middleman between advertisers and inventory owners like Netflix. As inventory owners scale, they are incentivized to sell directly to end ad-buyers, bypassing intermediaries like TTD.
At the same time, competition from Amazon and Google has intensified, especially given their control over proprietary inventory. Over time, this dynamic erodes pricing power and strategic control of middleman players like TTD.
My original thesis leaned too heavily on the secular shift from linear TV Ads to streaming (Connected TV Ads) which TTD was riding and I missed out on the all important Moat/USP.
TTD may still perform well, Jeff Green is an excellent CEO, but under my framework, the business lacks a sufficiently durable competitive advantage. For that reason, I am comfortable staying out (Famous last words hahaha..).
Final Takeaway
TTD is a reminder that great financials alone are not enough. Without a durable moat, even the most beautiful charts can unravel quickly.
Under my framework, understanding the business always comes first. Financials are confirmation, not conviction.
Criteria 5: Optionality & Catalysts
The concept of optionality in my framework is inspired by Peter Lynch’s question in One Up On Wall Street: “What’s the story?”
My evolution of that question is...
🔒Unlock below with premium tier: